//
Subscribe to the Tabnine newsletter
//
Get news and updates about AI, software development, and more.
Visual Studio Code (VS Code) is a free integrated development environment (IDE) provided by Microsoft. VS Code provides several features integrated into its editor that allow you to find and fix errors in your code.
VS Code supports debugging in a variety of programming languages, including JavaScript, TypeScript, Python, PHP, C++, and Go. Its debugging tools let you run your applications and scripts in a controlled environment, halt execution to inspect variables, evaluate expressions, and step through your code. VS Code also offers plugins like Tabnine AI code assistant, which will help fix errors identified in the IDE.
The debugging process starts with creating a configuration file, launch.json, which defines the workspace parameters for your debugging session. The parameters include the type of debugging, the request type, and the program to be debugged, among other settings. This file can be committed to your git repository to share configuration. Once you have this set up, you can start finding and fixing issues in your code.
This is part of a series of articles about Code Debugging
VS Code can help you debug the following types of applications:

Breakpoints allow you to pause the execution of your program at specific lines of code. This can be incredibly useful when trying to isolate a bug or understand how your program is operating. When you set a breakpoint, VS Code will stop running your program at that line, allowing you to examine the state of your application at that moment.
To set a breakpoint, click in the gutter to the left of the line number in your code editor. The red circle that appears signifies a breakpoint. You can add as many breakpoints as you want, and you can easily remove them by clicking on the red circle again.
VS Code offers several types of breakpoints: regular breakpoints, conditional breakpoints that only halt execution when a certain condition is met, and logpoints that log a message to the console without interrupting the execution.

Starting a debug session in VS Code is straightforward. After setting your breakpoints, you can start your debug session by clicking on the green play button in the Debug view or by pressing F5. Your application will run, and VS Code will halt execution at your breakpoints.
During your debug session, you have control over the execution of your program. You can step over functions, step into functions, step out of functions, and continue execution until the next breakpoint.
To stop a debug session, click the red square button in the Debug toolbar, or press Shift + F5.

Navigating your code during a debug session is straightforward with VS Code Debugging. As your application runs and hits breakpoints, the debug toolbar appears at the top of the screen, providing several navigational controls:
Here are the main elements in the VS Code interface that can help with debugging.
The Variables window displays the values of variables that are currently in scope, allowing you to see how these values change as your code executes. You can find the Variables window in the Debug view on the left side of the screen.
In the Variables window, you can expand and collapse data structures to inspect their contents. You can also modify the values of variables during a debug session. This functionality is handy for testing how your program behaves under different conditions.

The Watch window is another powerful feature of VS Code debugging. It allows you to monitor the values of specific variables or expressions. Unlike the Variables window, which shows all variables in scope, the Watch window only displays the variables or expressions that you’ve specifically chosen to monitor.
You can add a variable or expression to the Watch window by clicking the “+” button and typing in the name of the variable or the expression. The Watch window will then display the current value of that variable or the result of that expression. Every time the execution of your program is paused, the Watch window updates the values it displays.

The hover-to-inspect feature is a handy tool for quickly checking the value of a variable or the result of an expression. While in a debug session, you can hover your mouse over a variable or an expression in your code, and a tooltip will appear showing the current value or result.
The hover-to-inspect feature saves you time because you don’t need to switch to debug view to check the Variables or Watch windows. You can get the information you need right in your code editor.
To further enhance your debugging skills, let’s look at some best practices for VS Code debugging.
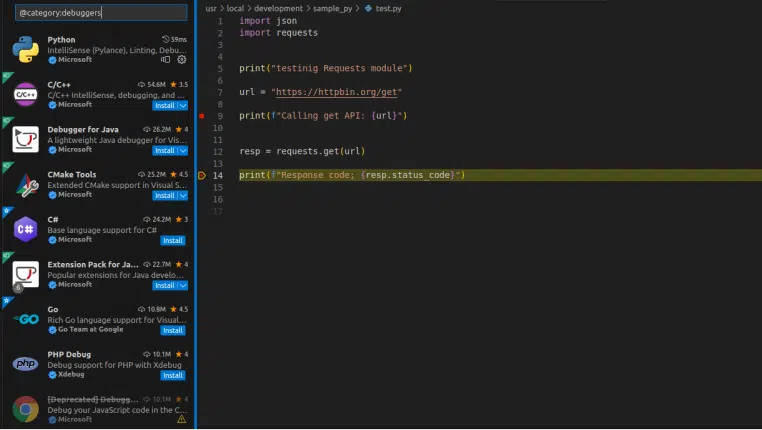
VS Code’s marketplace has a vast selection of extensions that can enhance your debugging experience. Whether you’re debugging a Node.js, Python, C/C++, or Dockerized application, there’s likely an extension that can make your life easier.
These extensions can add functionality like advanced breakpoints, interactive consoles, automatic error detection, and more. They can also integrate with external tools like linters, formatters, and testing frameworks, providing a unified debugging experience.
Learn more in our detailed guide to Python code debugging
One of the strengths of VS Code is its configuration flexibility. You can tailor your debugging settings to your needs, and then use these settings across different projects. This is achieved through the use of launch.json and tasks.json files:
Once set up, these configurations and tasks can be used across your projects, saving you time and ensuring a consistent debugging environment.

While VS Code provides extensive debugging features, the process can still be time-consuming, and often debugging tasks take up a large part of a developer’s valuable time. Today it’s possible to largely automate this process and debug your code with low effort by leveraging generative AI technology.
For most developers, the process for fixing errors in your code starts with an IDE plugin that notifies them there are errors in the code. Some of these tools provide recommendations that can help with simple errors.
However, for complex debugging, developers will have to manually investigate the error. This might require getting feedback from other developers or searching online for similar issues, based on the limited information provided from the debugging tool. Traditional debugging tools today don’t tell developers how to resolve the error, and the help they provide isn’t personalized to their specific problem. This makes it difficult and time consuming to solve programming errors.
Read more about AI for software development in our guide for AI coding tools.
Tabnine is an AI coding assistant that accelerates and simplifies software development while keeping your code private, secure, and compliant. Its AI-powered chat and best-in-class AI code completions boost engineering velocity, code quality, and developer happiness. Debugging code is one of the common use cases of Tabnine.
Tabnine’s AI agent makes debugging code errors much easier. As tools identify errors with the code and error notifications emerge in the problems tab, or inline using colored indicators, developers can simply click on the error indicator and ask the Tabnine code assistant to suggest a fix.
In this demo video, you can see how Tabnine fixes an error identified in the IDE. It shows a React app written in TypeScript, where the IDE indicates coding errors denoted by red underlines. The developer highlights line 26 and uses the /fix-code command in the chat.
Based on the response, you can see that the problem lies in using a process instead of a window. Tabnine can directly apply that change, resolving the error and saving valuable time, without requiring the developer to leave the IDE to search Google for solutions.
With an AI code assistant like Tabnine, developers see massive efficiency gains by fixing errors almost instantly — rather than spending an hour to fix a complex issue, Tabnine can fix it in seconds. This improves productivity and increases developer velocity. Tabnine is integrated in all the major IDEs and supports more than 80 programming languages and frameworks. In addition to fixing code, Tabnine provides accurate, highly personalized results for generating code, writing unit tests, creating documentation, explaining legacy code, and much more.
Explore recent posts
//Explore recent posts
//
4 -min read

2 -min read

7 -min read
More Guides
//2 -min read
4 -min read
6 -min read